Grameen America works to provide loans for women entrepreneurs who want to grow their business.
The members of the program can choose to stay as long as they want,
incrementally asking for higher loans as they pay them back.
Grameen America would like to determine the variables that help predict which members stay with them longer.
What variables help explain retention?
All members of Grameen America were asked to take a Questionnaire before and after receiving their loans. All this data was integrated into a dataset which was analyzed to understand if there were
certain variables that affected retention more than others.
Shown below is the information included in the dataset as well as how retention was defined.
Grameen America Dataset: Collected Information
Identifiers
Indentification ID for branch and individual
Locations
State, Area, Zipcode, ...
Finances
Loan Info, Credit Card Usage, Bank Account
Home Information
Household Income/Provider, Housing Cost, Phone Carrier
Grameen / Non-Grameen Business
Business Category, Income, ...
Demographics
Race, Ethnicity, Children
Metrics of Retention
In order to predict retention from the variables, retention must be defined.
We decided to define retention as those who stay with the program.
As "retention" does not have a concrete definition, we experimented with three ways to define retention,
to figure out which definition best described the members that stayed with the Grameen program.
Shown below are the three retention metrics.
Metric 2: Member is considered retained if they have more than 2 completed cycles (binary category)
Metric 3: There are 3 categories of retention that a member can fall under:
1. No Retention --> 0-2 completed loan cycles (~41% of members)
2. Retention --> 3-9 completed loan cycles (~43% of members)
3. Long Term Retention --> 10 or more completed loan cycles (~15% of members)
In general, Metric 1 produced differing results or no trends, while Metric 2 and Metric 3 produced similar results. Retention Metric 3 had three levels of retention, based on the total number of loan cycles a member has. Because Retention Metric 3 showed “levels” of retention, we decided to use Retention Metric 3 for the rest of our analysis.
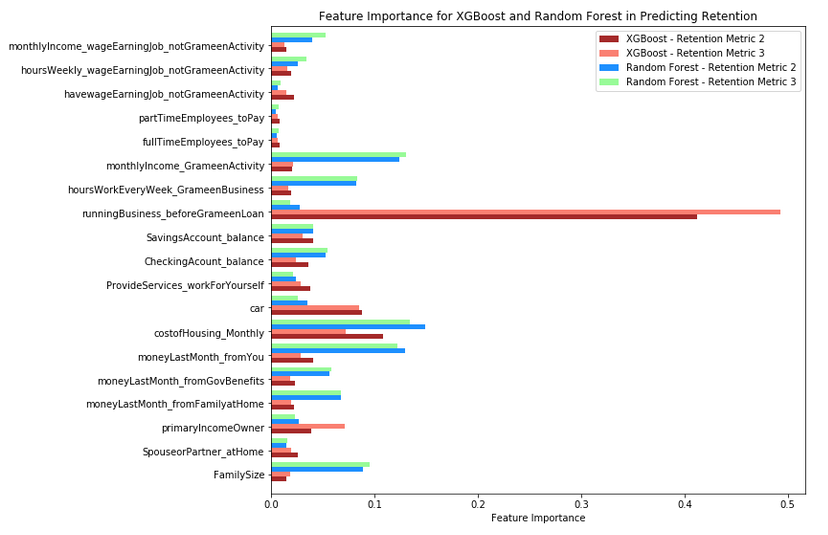
Feature Importance Analysis
From a feature importance analysis using XGboost and Random Forest Models we found out that the variable
"running a business before grameen" had a huge feature importance compared to the other features.
In other words, whether or not the member ran a business before coming to Grameen,
was a key indicator in predicting their retention.
Shown below is an example of a feature importance graph.
Shown below are two pie charts, one for those who answered "Yes" to running a business before Grameen
and one for those who answered "No" for running a business before Grameen.
The different colors correspond to how long they were retained (stayed with) Grameen America.
Housing Cost
This following histogram shows the distribution of Grameen America member housing costs grouped by Retention Metric 3. Members categorized as no retention concentrated towards the $1001-1200 range.
Housing Situation
Using Retention Metric 3, here is a graph of the housing situation of the members of Grameen America. The second graph shows a zoomed in version of the three categories with the lowest bars in the first graph.
Branch Analysis
Using Retention Metric 3, here is a graph for the retention based on each branch.